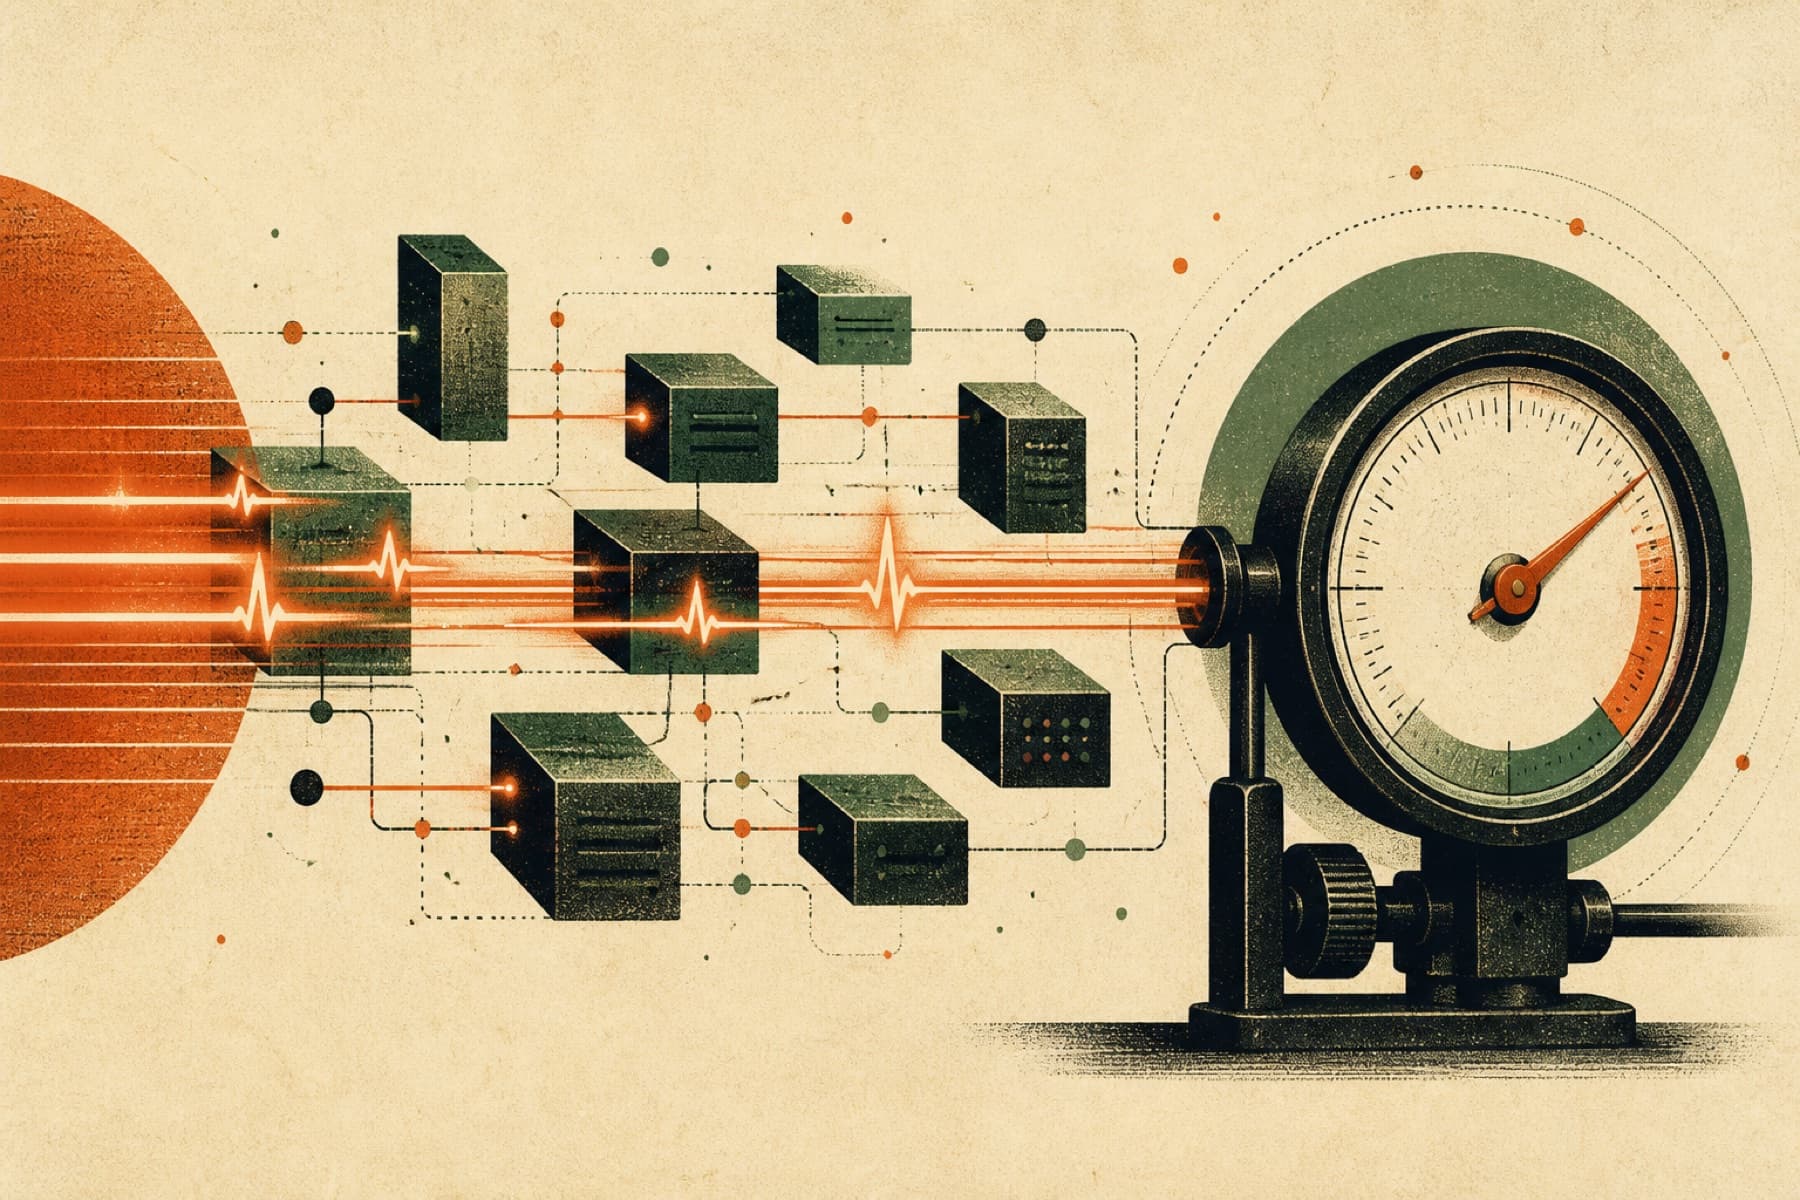
Users do not experience your service boundaries, queue topology, or database indexes. They experience the time between an action and a trustworthy response. That makes latency a product property before it becomes an infrastructure metric.
Averages hide the product
Average latency is comforting and frequently misleading. A realtime ordering system can look healthy at the median while a meaningful group of customers waits several seconds for an inventory update. Those slow requests are often the ones created by load, retries, cache misses, or a struggling dependency—the exact conditions that matter most.
Measure percentiles and measure them at the user boundary. p50 describes the common path, p95 shows recurring friction, and p99 exposes the tail that support teams eventually hear about. A service-level chart is useful only when it can be connected to a real journey such as placing an order or seeing stock change.
Give the journey a budget
A latency budget turns “make it fast” into an engineering constraint. If an order must propagate in under 200 milliseconds, divide that time across ingress, validation, persistence, publication, fan-out, and client rendering. The allocation does not need to be perfect on day one. Its value is that every component now has a boundary and every new dependency has a visible cost.
Budgets also improve design discussions. A team can decide whether stronger consistency is worth an extra round trip, whether a synchronous side effect belongs on the critical path, or whether the UI should acknowledge locally while confirmation travels through the system.
Remove work from the critical path
The fastest request is the work you do not perform synchronously. Validate what is required, commit the authoritative state, publish the event, and move secondary effects out of the response path. Emails, analytics, search indexing, and nonessential enrichment can happen asynchronously when the product contract allows it.
This does not mean making everything eventually consistent. It means being explicit about which state must be true before you respond and which state may converge afterward.
Realtime needs backpressure
WebSockets make updates feel immediate, but they do not remove capacity limits. A slow consumer, a reconnect storm, or a hot merchant can create more outbound work than the system can deliver. Bounded queues, coalescing repeated updates, and per-tenant limits prevent one noisy stream from turning every customer's realtime experience into a backlog.
When the client reconnects, it should recover from an authoritative checkpoint rather than hoping it received every transient message. Realtime transport is a notification layer; durable state still needs a source of truth.
Instrument the whole path
A timestamp at one service is not enough. Carry a correlation identifier across the event path and record the moments that matter: accepted, persisted, published, consumed, and rendered. Histograms should use consistent buckets, and traces should preserve tenant and operation context without leaking sensitive data.
The best latency review asks three questions: where did the time go, why did the tail grow, and what will the user notice?
Defend the budget continuously
Performance regresses through small, reasonable changes: another query, a larger payload, a synchronous log sink, or a retry with no jitter. Put representative benchmarks in CI where possible, alert on user-facing percentiles, and review latency changes alongside feature changes.
Speed is not polish applied after correctness. In a realtime product, the timing of the answer is part of whether the answer is correct.
A latency-budget worksheet
| Segment | p95 budget | Evidence |
|---|---|---|
| Client input and rendering | 50 ms | browser/mobile trace |
| Network and edge | 80 ms | request timing |
| API and authorization | 40 ms | server span |
| Database transaction | 50 ms | database span |
| Event fan-out | 80 ms | broker and socket spans |
| Safety margin | 100 ms | remaining budget |
The numbers are examples, not universal targets. Start from the user promise, allocate a budget, and revise with field data. Report p50 for the common path, p95 for recurring friction, and p99 for the tail that often appears during load or dependency failure.
Trace the whole commerce flow
Use one correlation ID across HTTP, database, outbox, broker, and WebSocket spans. OpenTelemetry’s trace semantic conventions provide consistent naming for operations across services.
Alert on budget consumption
Alert when a segment consumes an abnormal share of the workflow budget, not only when a service crosses a generic threshold. Track event-commit-to-client-apply latency, reconnect recovery, queue age, database lock time, and the percentage of flows that require a retry.
Continue with the real-time systems cornerstone.